

Buyers & Growth
Website analysis
All seven analysis views explained tab by tab — overview, trends and funnel, geography and payments, shipping, product P&L, storefront health, and the built-in profit calculator.
Where the dashboard gives you the headline, this screen gives you the reason. Seven tabs, each answering a different question.
Where to find it: menu → Website → Website Analysis.
Which tab answers which question
| Tab | The question it answers |
|---|---|
| Overview | How is the shop doing overall? |
| Trends & Funnel | Is it getting better or worse, and where do orders stall? |
| Geography & Payments | Where are my buyers, and how do they pay? |
| Shipping & Logistics | Which couriers and regions are letting me down? |
| Products & P&L | Am I actually making money? |
| Storefront & Health | Is my setup complete, and are my numbers healthy? |
| Profit Calculator | What would profit look like at a different scale? |
Overview
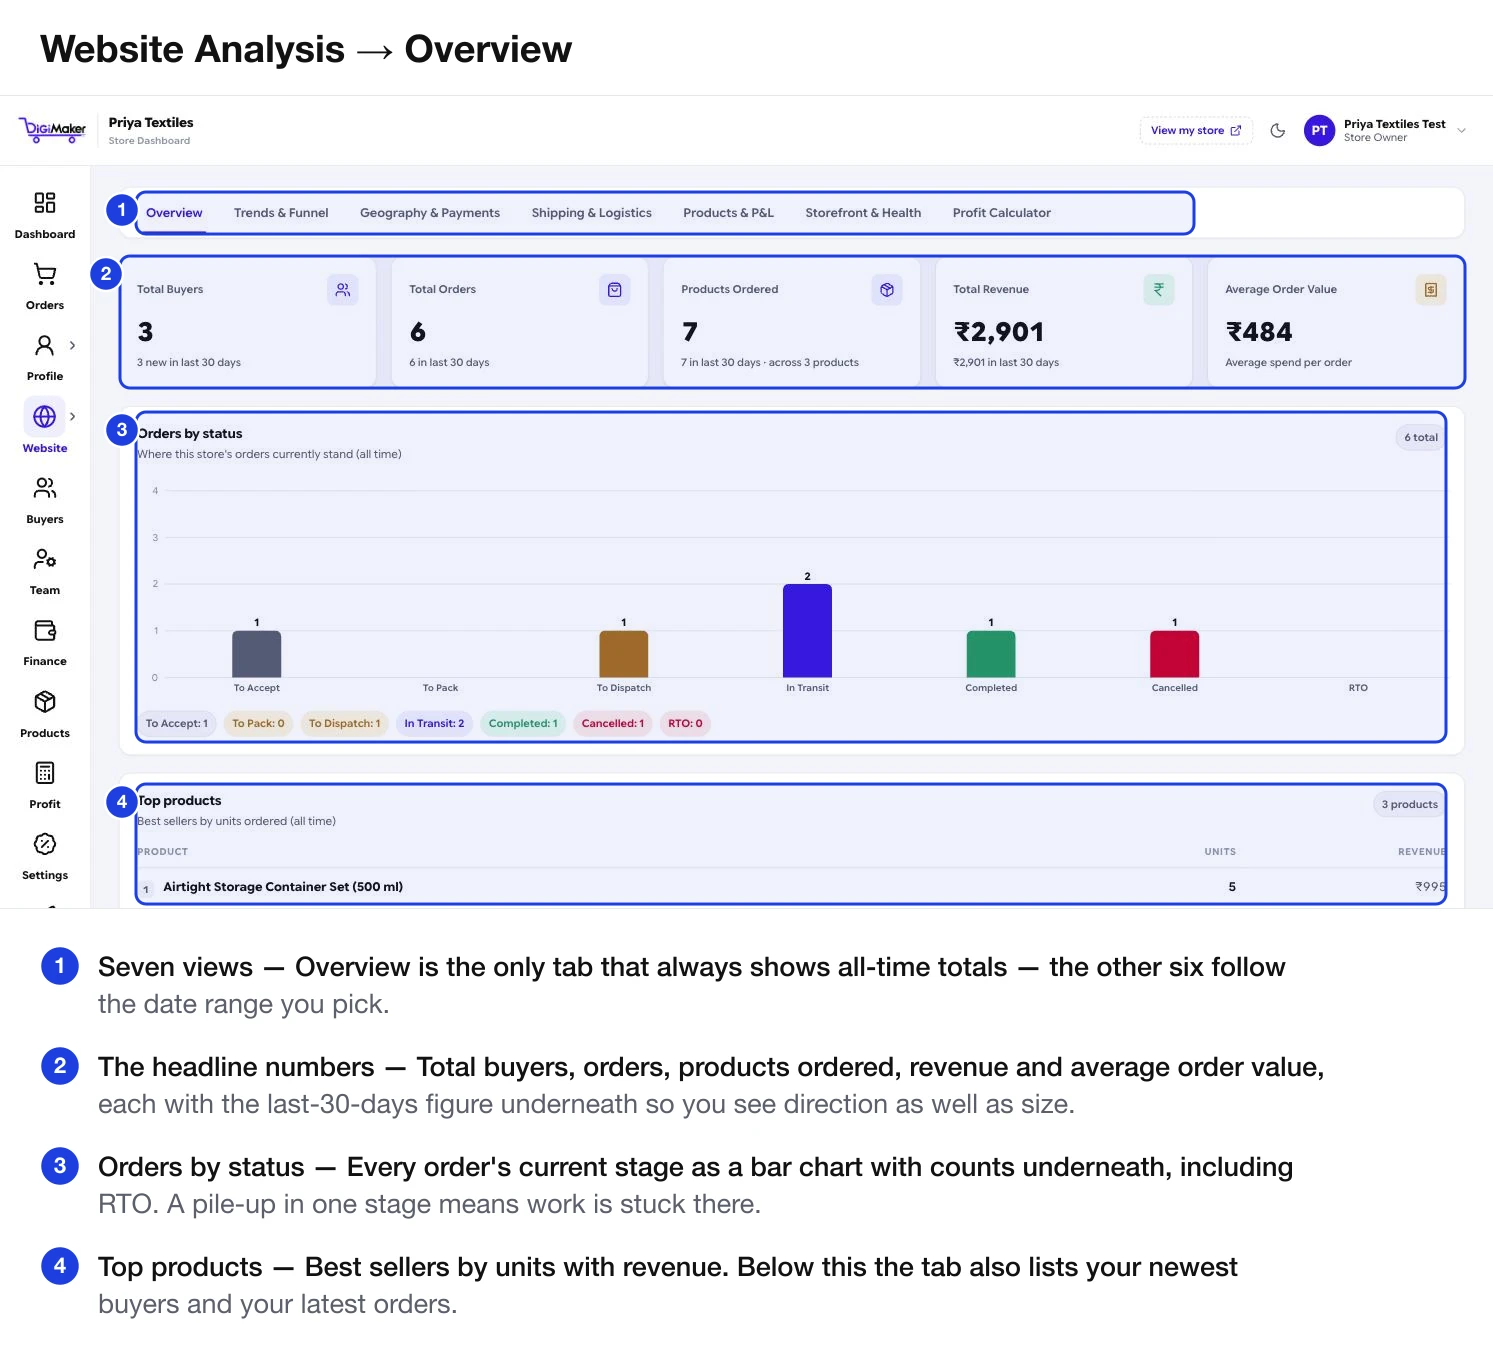
Total buyers, orders, products ordered, revenue and average order value — each with a last-30-days figure underneath. Then Orders by status as a bar chart with a count per stage, Top products by units, Recent buyers, and Recent orders.
Trends & Funnel
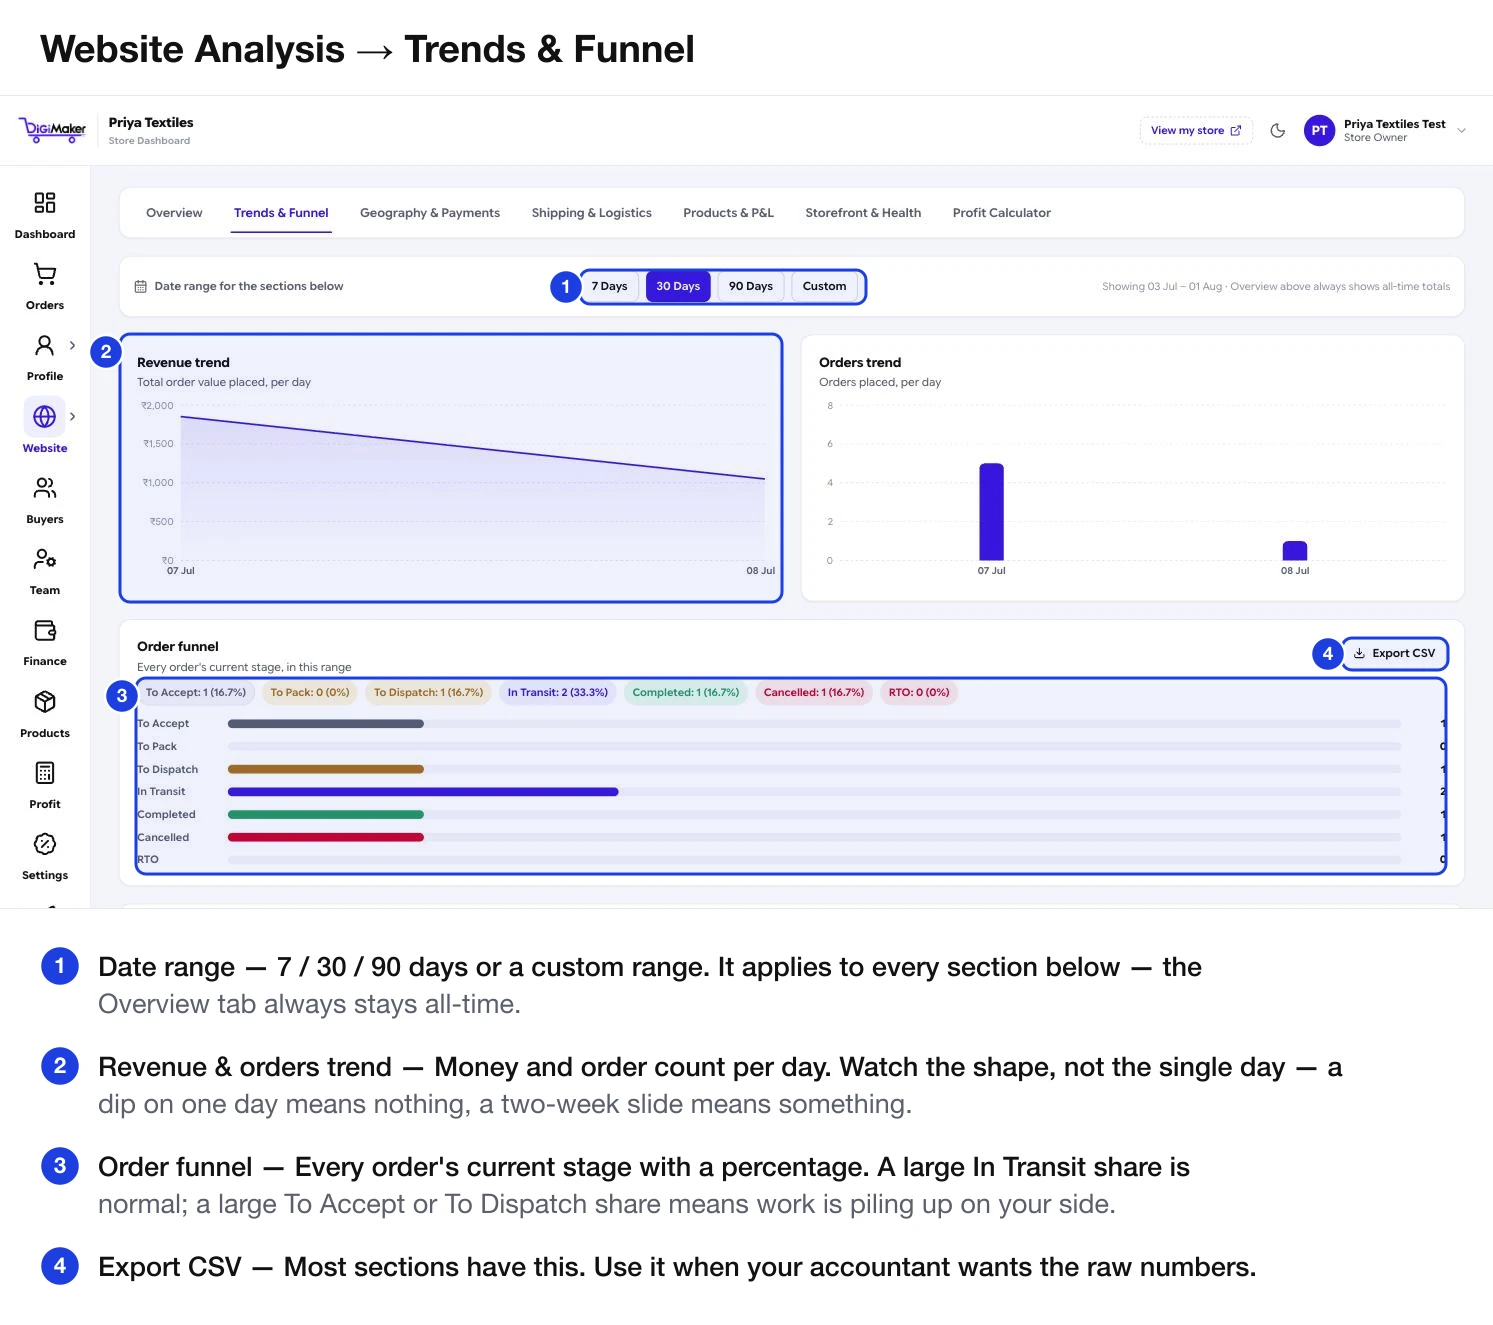
- Revenue trend and Orders trend — money and order count per day.
- Order funnel — every order’s current stage with a percentage.
- Cancellations — how many, broken down by reason and by who cancelled (you, the buyer, or the system).
Geography & Payments
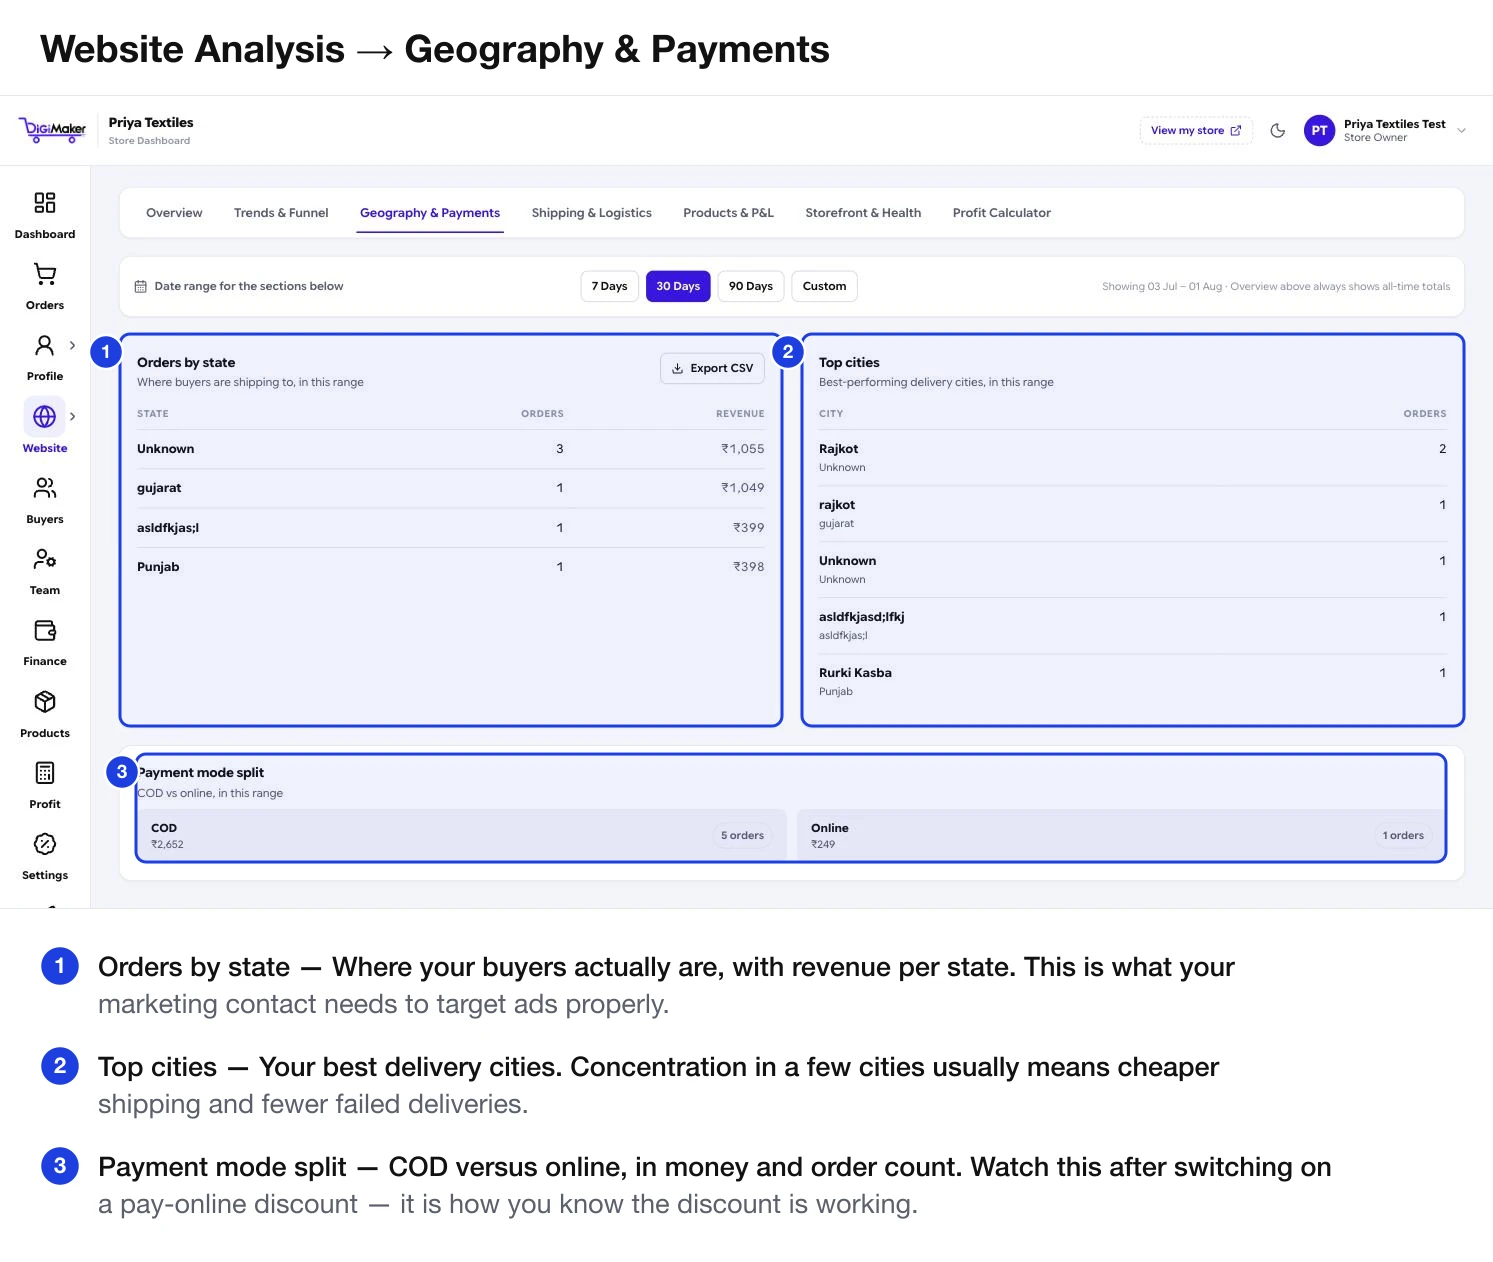
- Orders by state — orders and revenue per state. This is what your marketing contact needs to target ads properly.
- Top cities — your best delivery cities. Concentration usually means cheaper shipping and fewer failed deliveries.
- Payment mode split — COD versus online, in both money and order count.
Shipping & Logistics
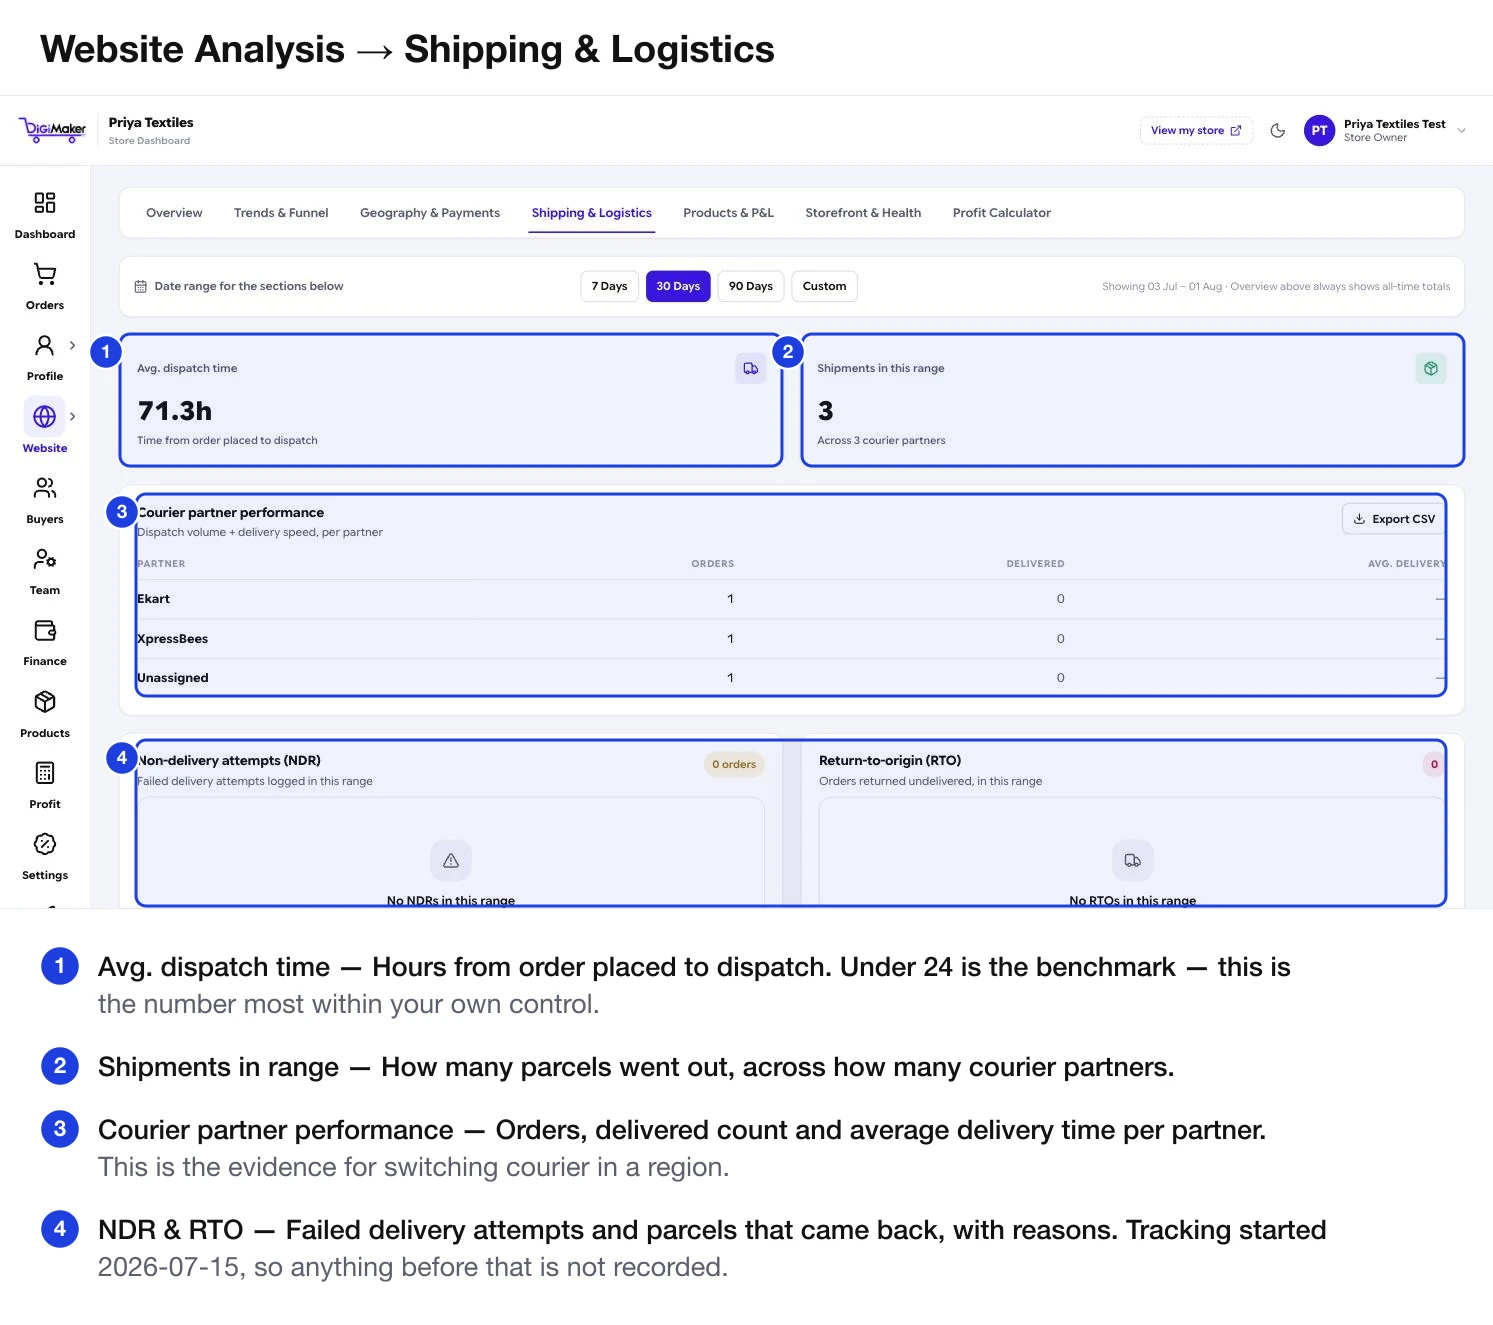
- Avg. dispatch time — hours from order placed to dispatch. The benchmark is under 24.
- Shipments in range — how many parcels, across how many partners.
- Courier partner performance — orders, delivered count and average delivery time per partner. This is your evidence for switching courier in a region.
- Non-delivery attempts (NDR) and Return-to-origin (RTO) — with reasons and resolution.
- Returns per month — RTO counted in the month the parcel came back, over 12 months.
Products & P&L
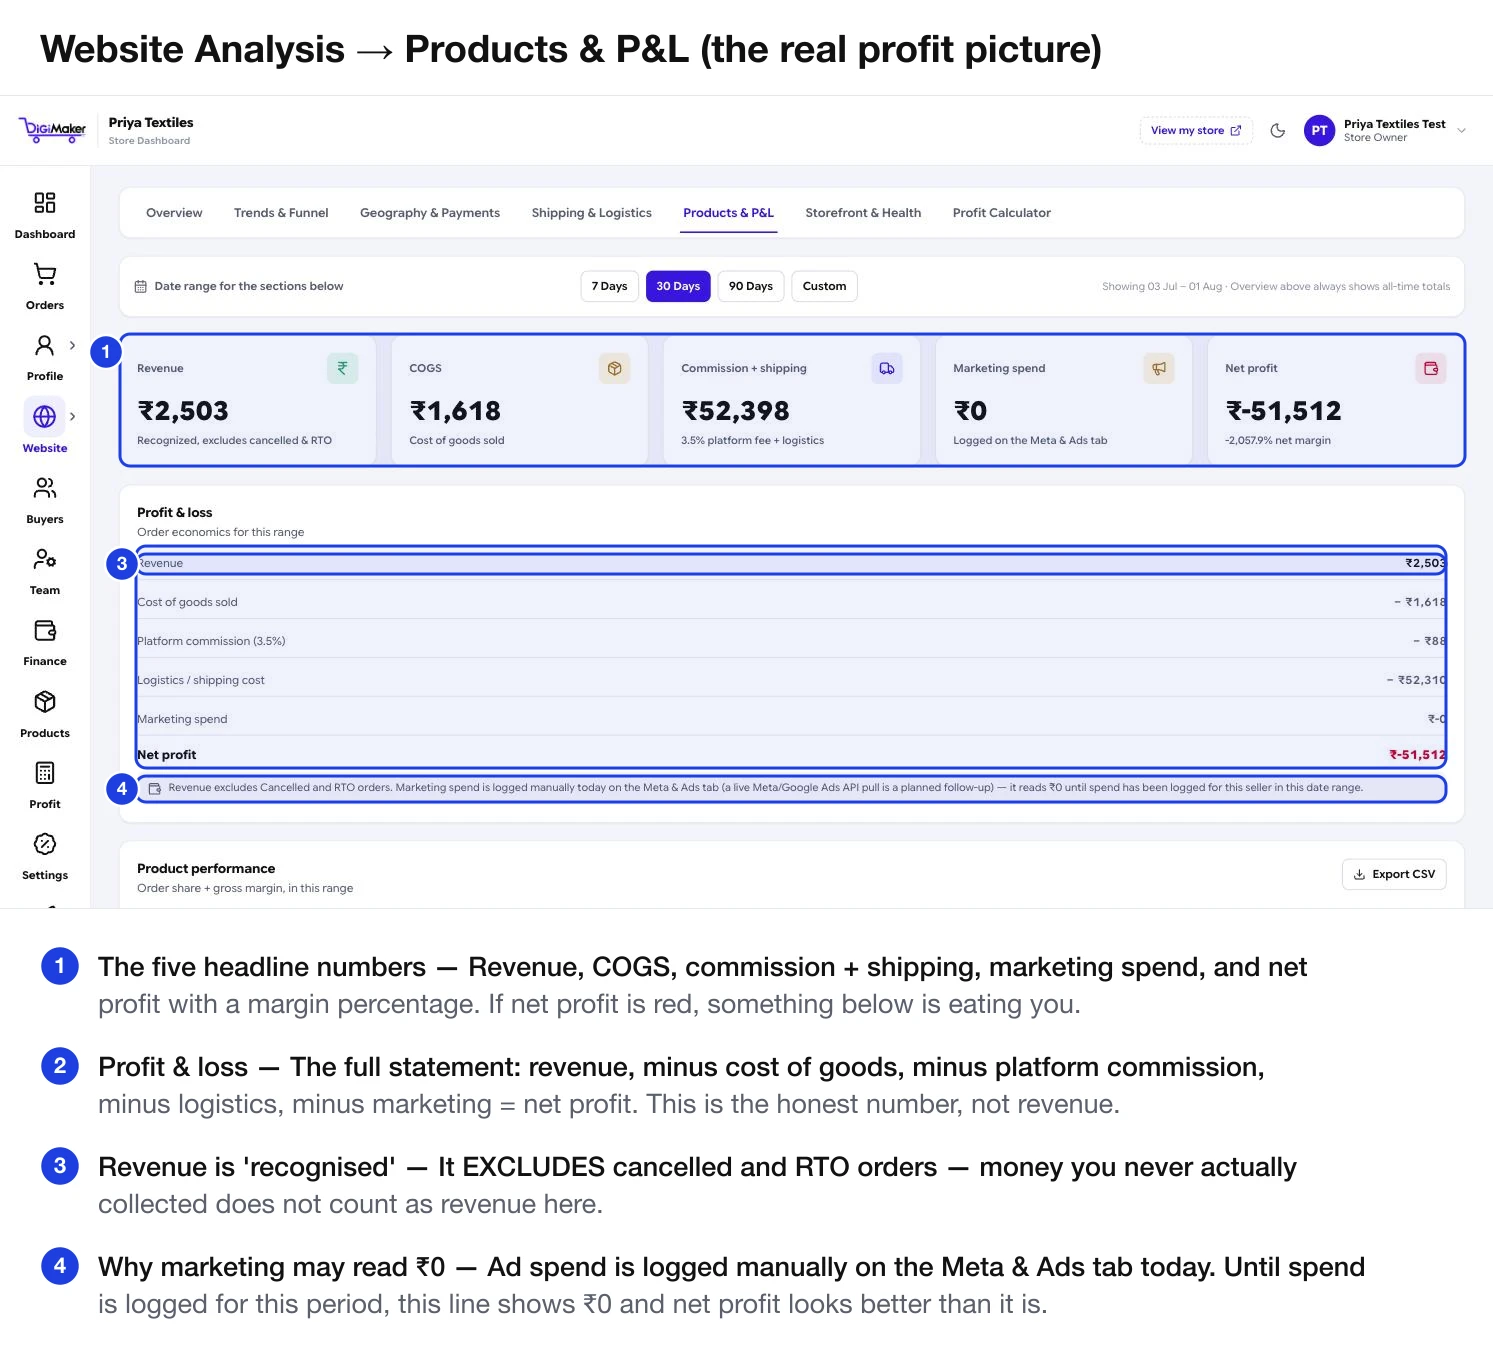
Five headline figures — Revenue, COGS, Commission + shipping, Marketing spend, Net profit with a margin percentage — then the full statement:
Revenue− Cost of goods sold− Platform commission− Logistics / shipping cost− Marketing spend─────────────────────────= Net profitBelow that, Product performance: units, revenue, order share and gross margin per product.
Storefront & Health
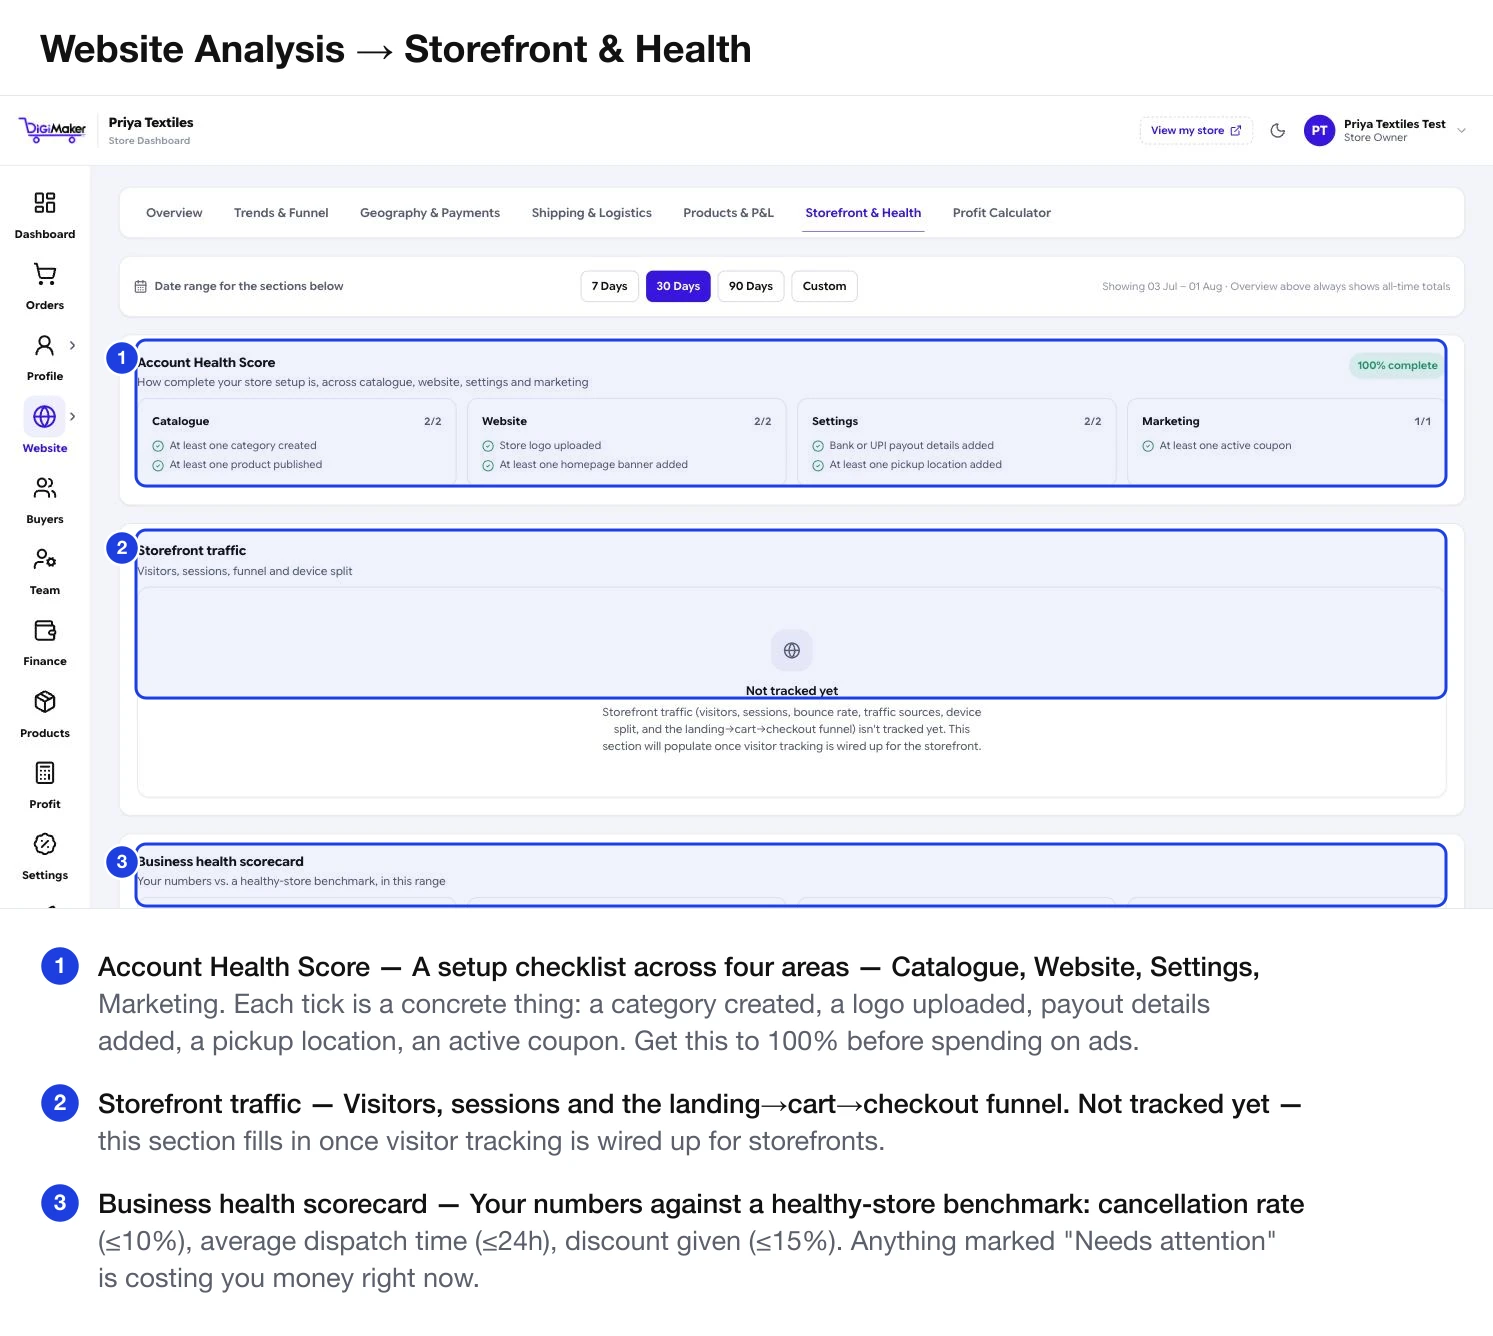
Account Health Score
A concrete setup checklist across four areas — each tick is a real thing:
| Area | What it checks |
|---|---|
| Catalogue | At least one category created · at least one product published |
| Website | Store logo uploaded · at least one homepage banner added |
| Settings | Bank or UPI payout details added · at least one pickup location added |
| Marketing | At least one active coupon |
Storefront traffic
Visitors, sessions, bounce rate, traffic sources, device split and the landing → cart → checkout funnel. Not tracked yet — this section fills in once visitor tracking is wired up for storefronts.
Business health scorecard
Your numbers against a healthy-store benchmark, each marked Healthy or Needs attention:
| Measure | Benchmark |
|---|---|
| Cancellation rate | ≤ 10% |
| Avg. dispatch time | ≤ 24 hours |
| Discount given | ≤ 15% |
| Storefront conversion rate | Needs visitor tracking |
Anything marked “Needs attention” is costing you money right now.
Profit Calculator
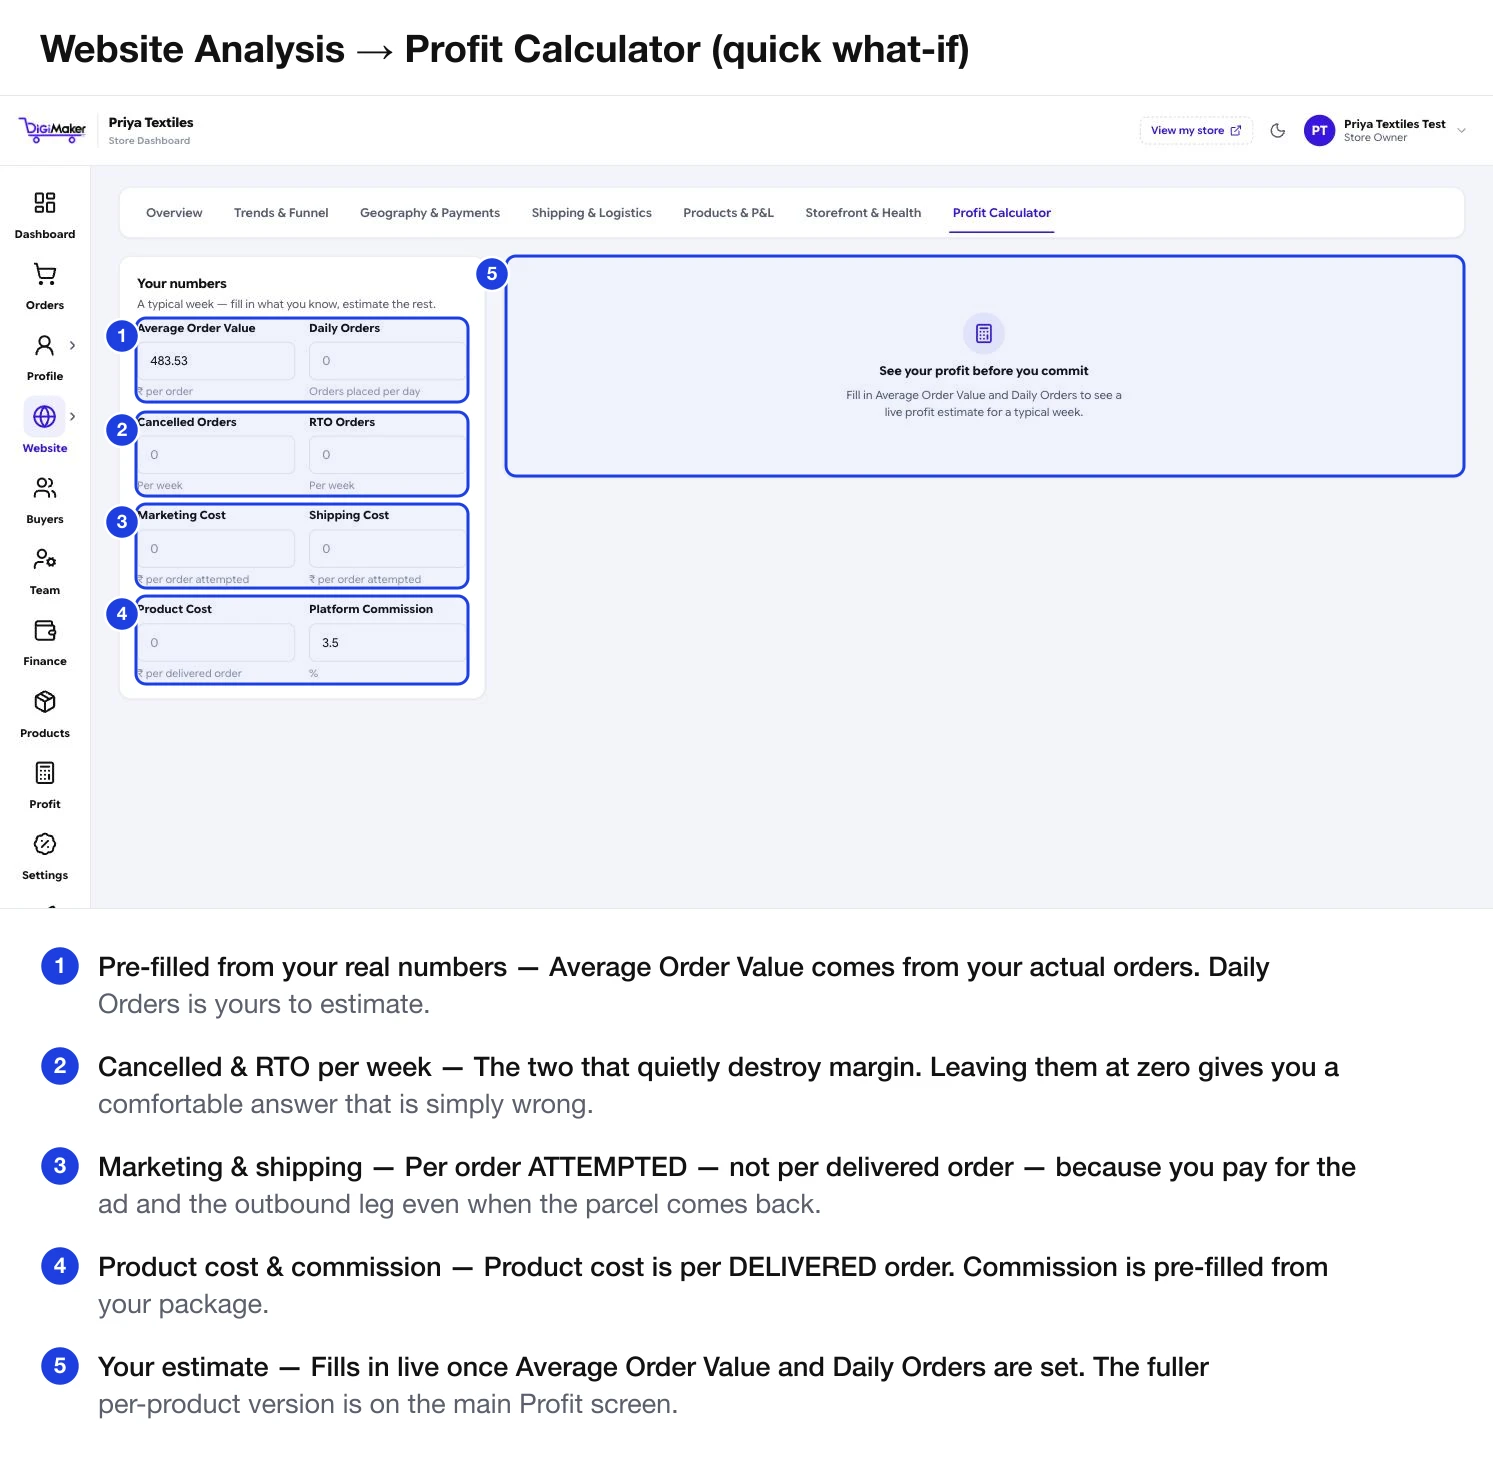
A quick what-if: Average Order Value and Daily Orders are pre-filled from your real numbers, and you estimate the rest — cancelled and RTO orders per week, marketing and shipping cost per order attempted, product cost per delivered order, and your platform commission.
The fuller version, including per-product margins, is on the main Profit calculator screen.
A monthly routine
Overview
Storefront & Health
Trends & Funnel
Products & P&L
Shipping & Logistics
Profit Calculator